The first time you open a public dataset, it rarely feels like a story. It feels like a chore: thousands of rows, column names written by a committee, a date field that changes format halfway down. Then you sort one column and something appears. One landlord filed forty eviction notices in a single month. A school district spends three times what its neighbour does. A road with no reported crashes for a decade turns out to have been closed for most of it.
The spreadsheet was never the point. It is a way of asking better questions.
Start With a Question, Not a File
Most beginners download everything and hope. A better habit is to arrive with a hypothesis you can test in a few steps. "Which landlords filed the most eviction notices in this county last year?" is a good question: it names a subject, a place and a period, so it tells you which columns you need and when you can stop.
Write that question at the top of a plain text file, then add three or four sub-questions — how does this compare with last year, how does it break down by neighbourhood, who owns the buildings. That file becomes your notebook. Every cleaning decision and every dead end goes in it, dated.
If you cannot yet phrase a question, browse first. Read the dataset's documentation, the agency's annual report and whatever has already been written on the subject. The gaps in that coverage usually point somewhere useful.
Where to Find Data
Good material is more available than most people assume, and it is usually free. Places worth checking:
- Government portals. National statistics offices, city open-data sites, transport, health and environment agencies. Many publish the documentation explaining how the numbers were collected.
- Records requests. Anything unpublished can often be requested: inspections, contracts, payroll, correspondence. Ask for machine-readable files rather than scanned PDFs.
- Court, property and licence records. Ownership, permits and fines are frequently searchable by address or name.
- International bodies. Statistical arms of the UN, the World Bank and Eurostat publish comparable country-level data.
- Your own reporting. A spreadsheet of 200 addresses you visited is a dataset, and nobody else has it.
Whichever route you take, ask what was left out. A register covering only licensed operators, or a survey with a low response rate, is telling you something before you open it.
Cleaning Is Most of the Work
Raw data is rarely tidy. Names arrive as "St Mary's", "St Marys" and "SAINT MARYS". Dates arrive as text. One row represents an incident, the next represents a person. Some files contain duplicates created when a record was amended years later.
Two rules save hours of misery. Never edit the original file — keep an untouched copy and work on a duplicate. And record what you did, so the process can be repeated and checked.
A short cleaning checklist
- Count the rows and compare with the number the source claims.
- Find a unique identifier. If there isn't one, decide what makes a record unique.
- Standardise dates, place names and capitalisation.
- Look at the blanks and decide whether each means zero, unknown or not applicable.
- Check for duplicates on the fields that should be unique.
- Count again afterwards. If you started with 12,400 rows and finished with 9,800, you should be able to explain the difference.
Four Analyses That Find Stories
- Rankings and outliers. Sort a column. Who sits at the top, and how far ahead are they? An outlier is a lead, not a conclusion.
- Trends over time. Chart one measure across the years, then ask what changed at each turning point.
- Comparisons and rates. Raw counts favour big places. Divide by population, staff or kilometres of road so a small town and a capital can be compared honestly.
- Mismatches between datasets. Join two files on a shared field — a postcode, a company number — and look for what doesn't line up: money spent where no work was recorded, inspections missing at the highest-risk sites.
Interrogate the Numbers Before You Publish
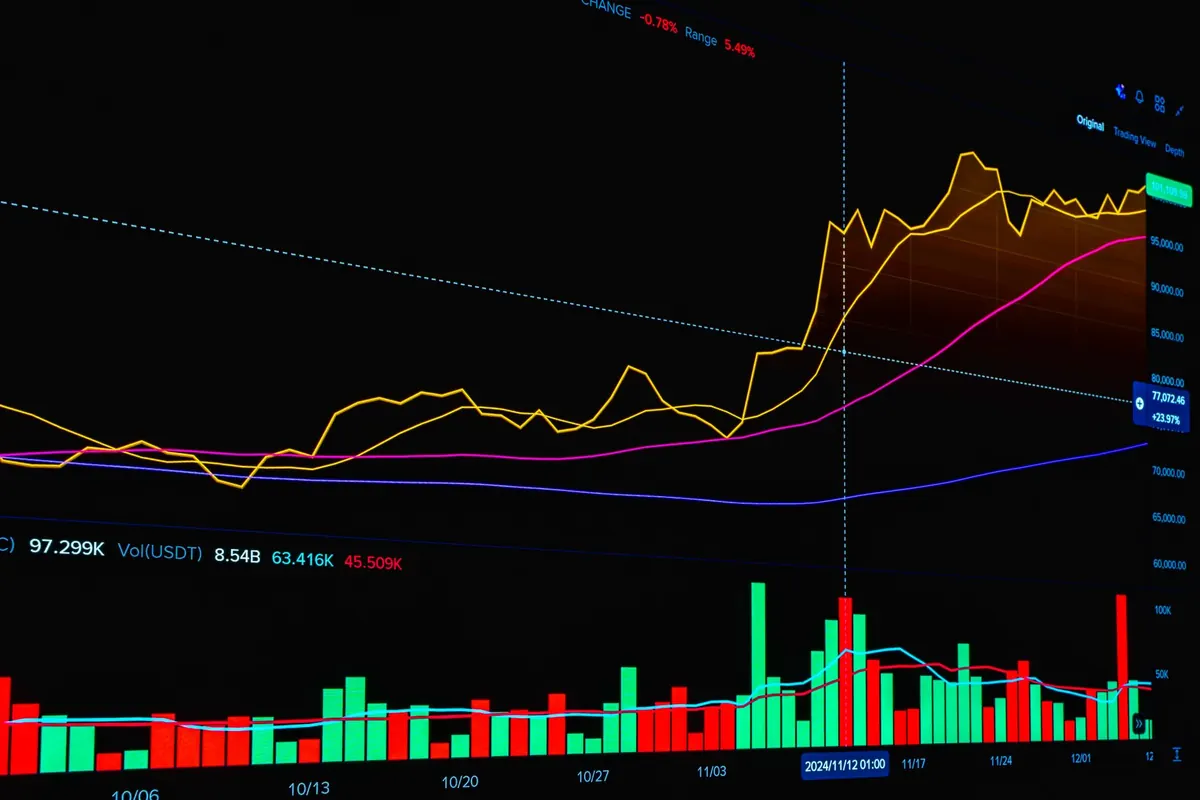
A chart can mislead without anyone lying. A y-axis starting at 97 turns a one-point change into a cliff. Two variables that move together may have nothing to do with each other; ice cream sales and drowning deaths both rise in summer because both follow the weather. Small counts wobble, too. Three cases this year against one last year is arithmetic, not a trend.
Then ask the source. Send your preliminary reading to the agency or company named in the data and give them a fair chance to respond. If they dispute it, you learn something. If they confirm it, you have a sentence for the story.
A number is a claim. Treat it the way you treat any other claim: find out who is making it, how they know, and what they might be missing.
From Numbers to Narrative
Data tells you what changed; reporting tells you why. A rise in reported incidents might reflect a real increase, a new recording system or a campaign encouraging people to come forward. Only people can tell you which. So call the names in the rows, visit the street, sit in the meeting.
In the writing, do two things at once. Show one case in detail, then state the pattern it belongs to. Keep charts simple, label the axes, name the source and the period covered. Put the caveat near the claim it qualifies rather than burying it at the end.
Your First Story in a Weekend
Pick something small and finish it. A workable rhythm:
- Friday evening. Choose one question and download one dataset. Read its documentation.
- Saturday morning. Clean it and count. This will take longer than you expect.
- Saturday afternoon. Rank, compare, chart. Write five bullets describing what you found, strongest first.
- Sunday. Take the best bullet. Verify it, contact two people who can speak to it, and draft 600 words with one chart and one example.
- Then file it. Publish or pitch, even if it feels thin. The second story is easier than the first.
Keep the cleaned file and your notes in a folder you can find again. Many data stories are built from material gathered months earlier and finally understood.
One last thing: if your story touches health, money or legal matters, run the claims past someone qualified before publishing — a specialist reporter, a lawyer, a statistician. Precision protects the people in your dataset as much as it protects you.
Photo: Adam Sondel / Pexels